Photo AI
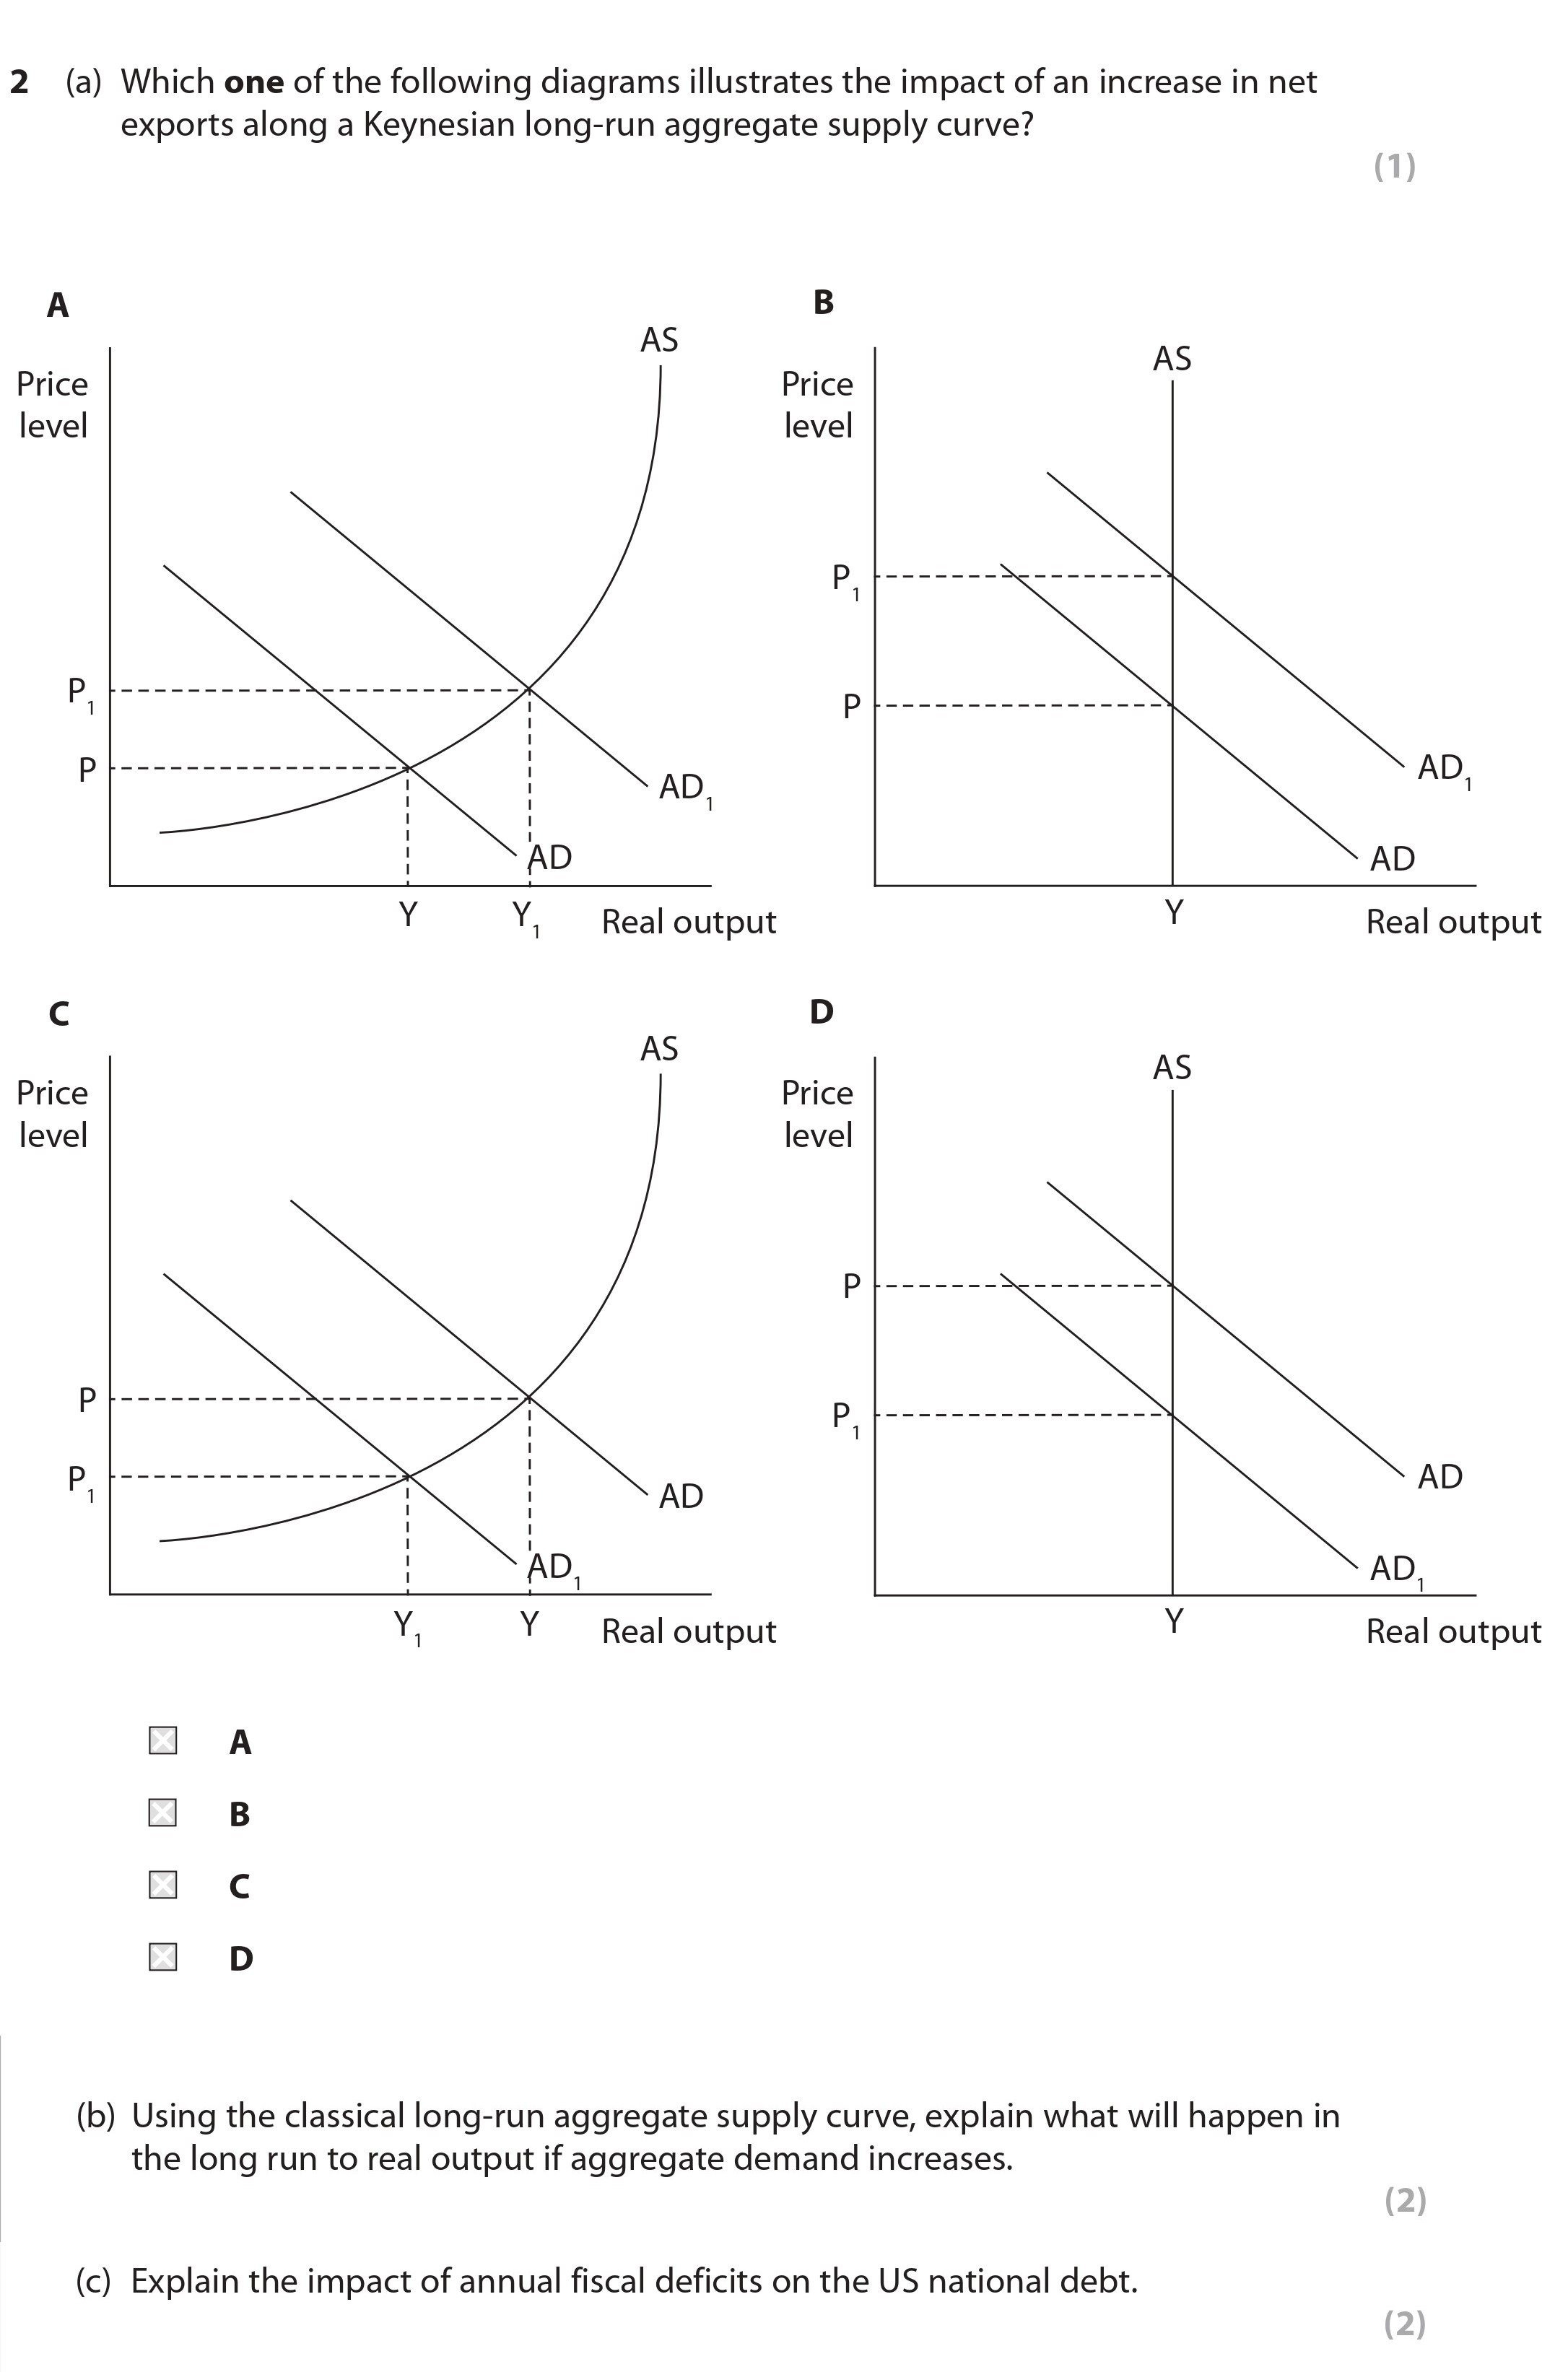
2 (a) Which one of the following diagrams illustrates the impact of an increase in net exports along a Keynesian long-run aggregate supply curve? A B C D (b) Using the classical long-run aggregate supply curve, explain what will happen in the long run to real output if aggregate demand increases - Edexcel - A-Level Economics A - Question 2 - 2021 - Paper 2
Question 2

2 (a) Which one of the following diagrams illustrates the impact of an increase in net exports along a Keynesian long-run aggregate supply curve? A B C D ... show full transcript
Worked Solution & Example Answer:2 (a) Which one of the following diagrams illustrates the impact of an increase in net exports along a Keynesian long-run aggregate supply curve? A B C D (b) Using the classical long-run aggregate supply curve, explain what will happen in the long run to real output if aggregate demand increases - Edexcel - A-Level Economics A - Question 2 - 2021 - Paper 2
Step 1
Which one of the following diagrams illustrates the impact of an increase in net exports along a Keynesian long-run aggregate supply curve?
Answer
The correct answer is A. This diagram represents an increase in aggregate demand (AD) due to higher net exports, shifting the aggregate demand curve rightward along the Keynesian long-run aggregate supply (AS) curve.
Step 2
Using the classical long-run aggregate supply curve, explain what will happen in the long run to real output if aggregate demand increases.
Answer
In the long run, there would be no change in real output. Classical economists assume that the economy operates at full employment in the long run. Therefore, any increase in aggregate demand would result in higher price levels rather than an increase in real output. A diagram illustrating the classical long-run aggregate supply curve is often represented as a vertical line, indicating that real output remains constant at the full employment level.
Step 3
Explain the impact of annual fiscal deficits on the US national debt.
Answer
Annual fiscal deficits lead to an increase in the national debt as the government borrows to cover the shortfall. Over time, persistent deficits accumulate, raising the national debt burden. This could result in negative impacts such as increased interest rates, a reduction in national savings, and potential crowding out of private investment. Additionally, a higher debt level may lead to reduced confidence among investors and consumers, impacting overall economic growth.
