Photo AI
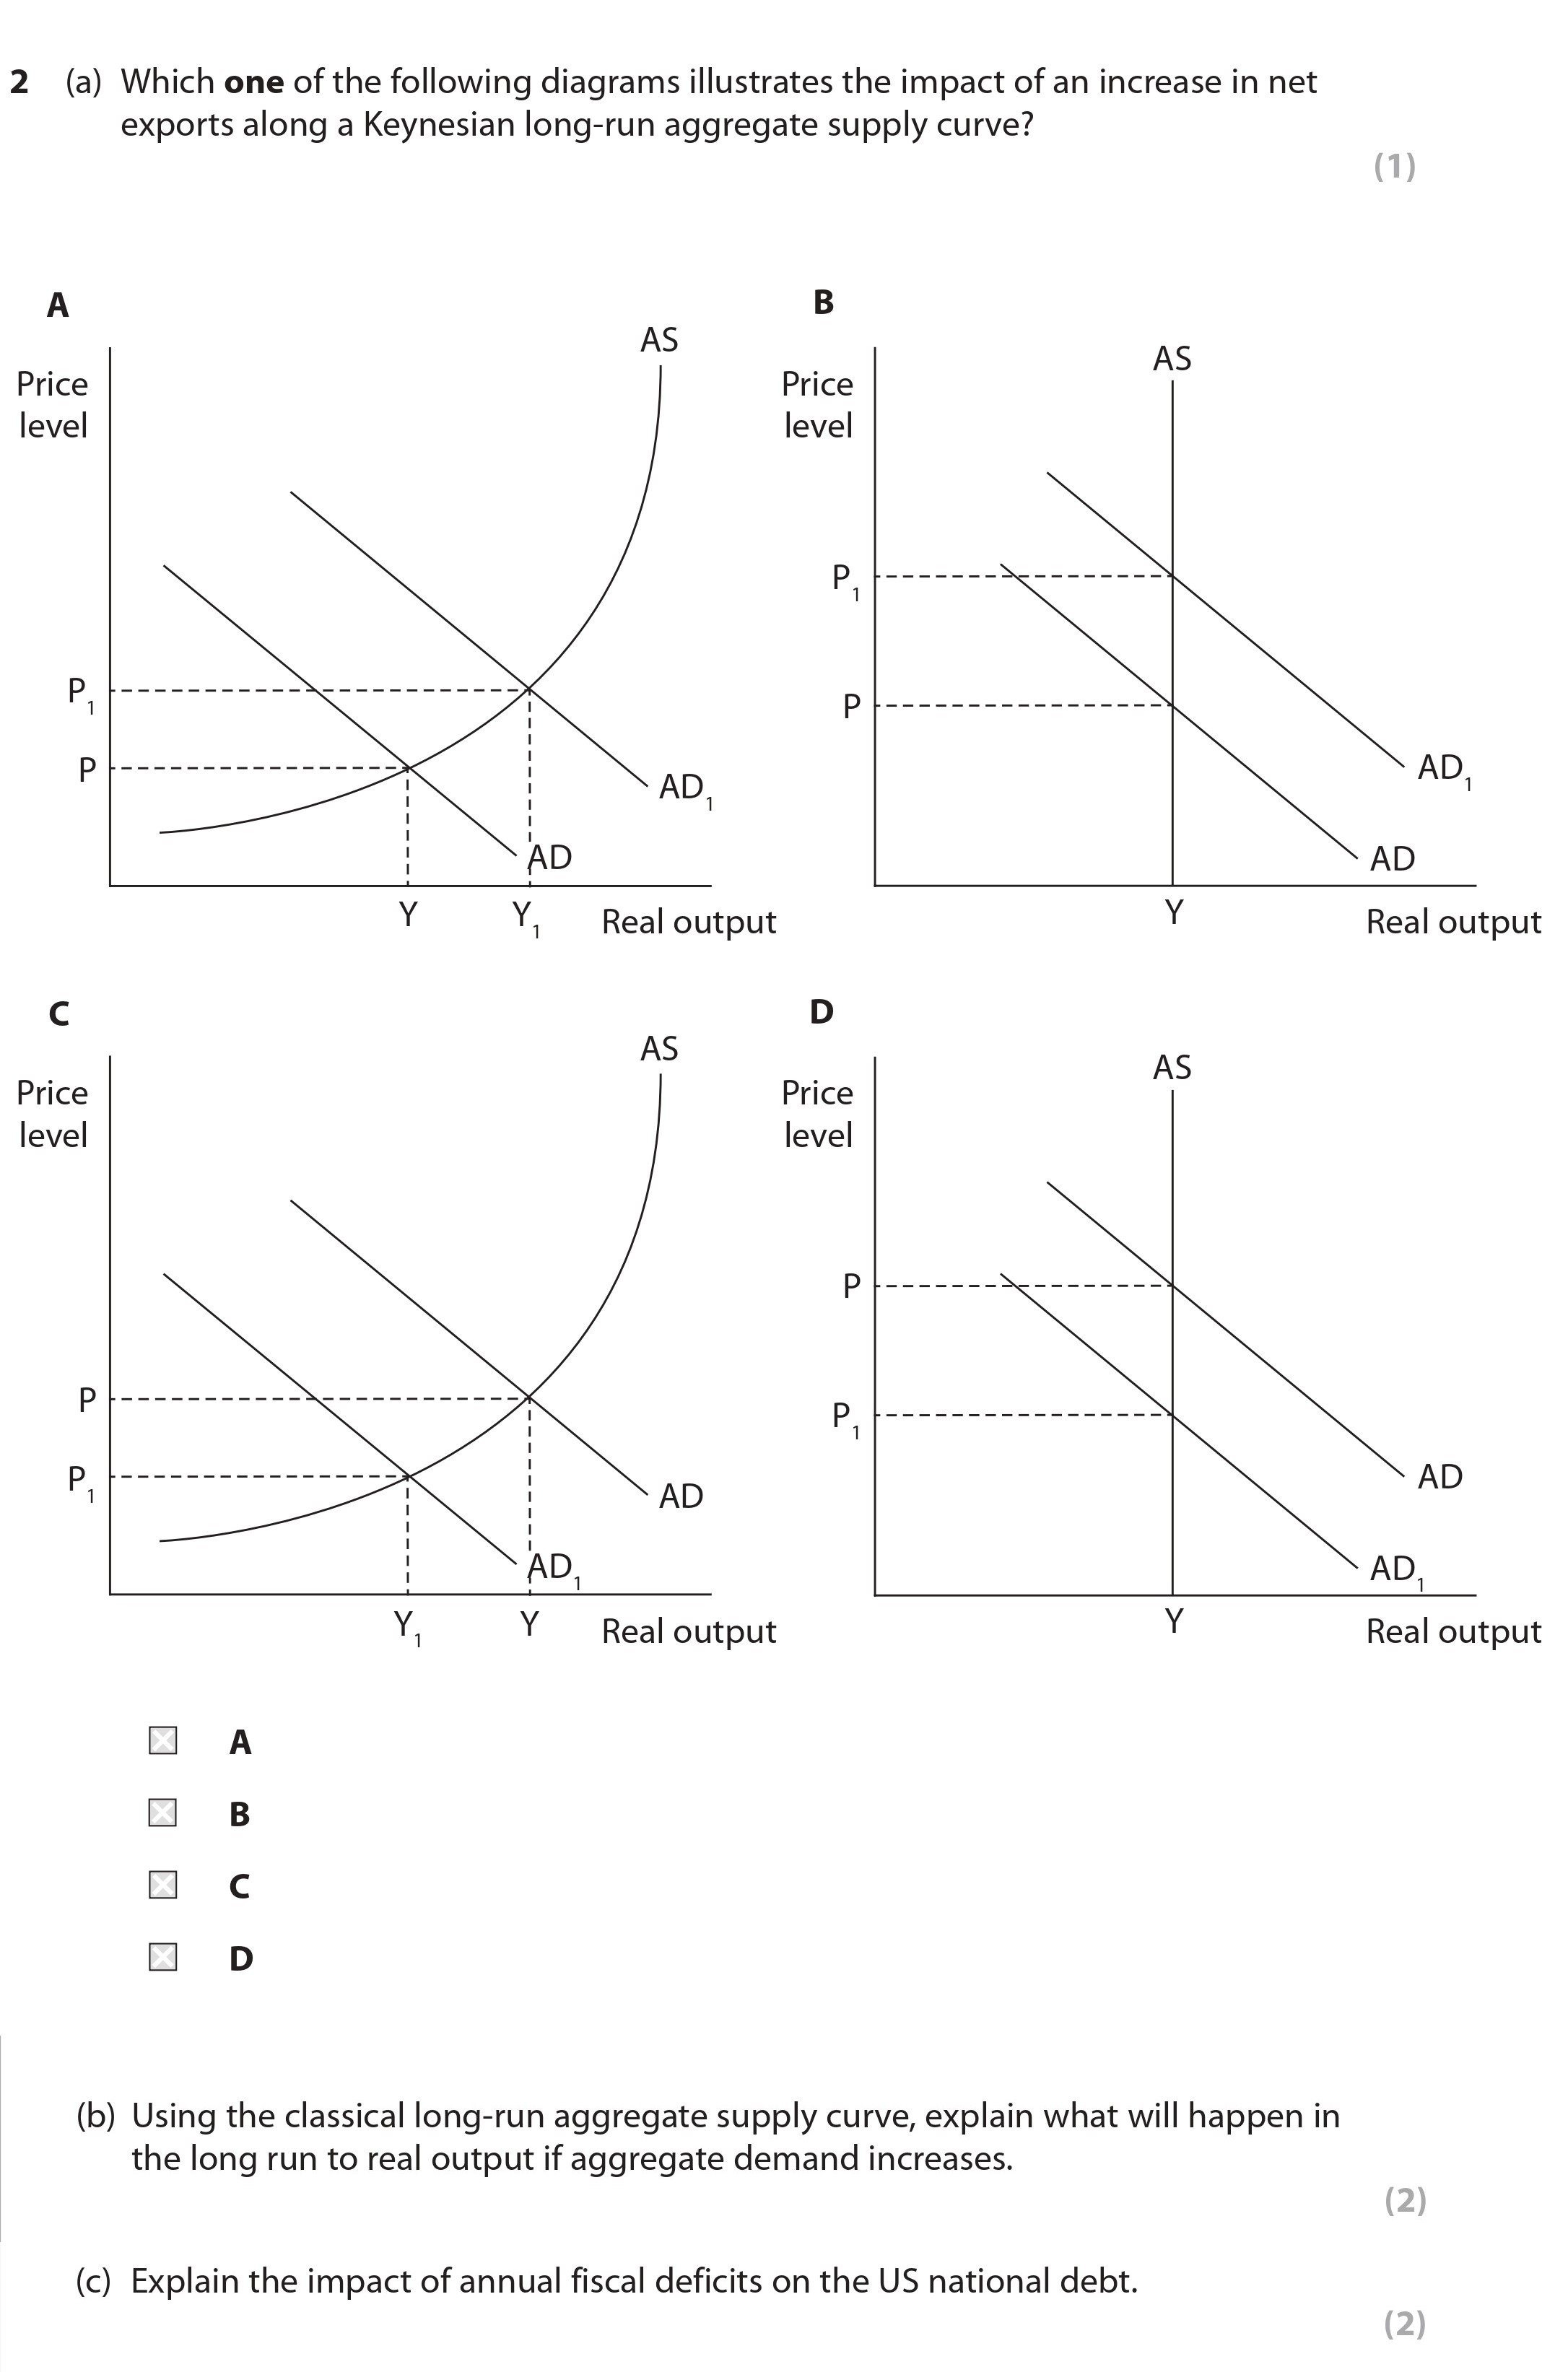
2 (a) Which one of the following diagrams illustrates the impact of an increase in net exports along a Keynesian long-run aggregate supply curve? A B C D (b) Using the classical long-run aggregate supply curve, explain what will happen in the long run to real output if aggregate demand increases - Edexcel - A-Level Economics A - Question 2 - 2021 - Paper 2
Question 2

2 (a) Which one of the following diagrams illustrates the impact of an increase in net exports along a Keynesian long-run aggregate supply curve? A B C D ... show full transcript
Worked Solution & Example Answer:2 (a) Which one of the following diagrams illustrates the impact of an increase in net exports along a Keynesian long-run aggregate supply curve? A B C D (b) Using the classical long-run aggregate supply curve, explain what will happen in the long run to real output if aggregate demand increases - Edexcel - A-Level Economics A - Question 2 - 2021 - Paper 2
Step 1
Which one of the following diagrams illustrates the impact of an increase in net exports along a Keynesian long-run aggregate supply curve?
Answer
The only correct answer is A. This diagram best shows the increase in aggregate demand (AD) caused by rising net exports, reflected as a rightward shift of the AD curve along a Keynesian long-run aggregate supply (LRAS) curve.
Step 2
Using the classical long-run aggregate supply curve, explain what will happen in the long run to real output if aggregate demand increases.
Answer
In the classical long-run aggregate supply curve, an increase in aggregate demand will not change real output. This is because classical economists believe the economy operates at full employment in the long run. Thus, while the price level may rise, real output remains stagnant at the natural level of output.
A diagram illustrating this would show a vertical LRAS curve, indicating that real output is fixed.
Step 3
Explain the impact of annual fiscal deficits on the US national debt.
Answer
Annual fiscal deficits typically lead to an increase in national debt.
- Identification of likely impact: More government borrowing raises the overall debt level.
- Analysis: This can result in:
- A negative wealth effect, where higher debt levels may lead to increased taxes in the future, curbing consumer spending.
- A reduction in consumer and business confidence due to fears of future fiscal instability.
