Photo AI
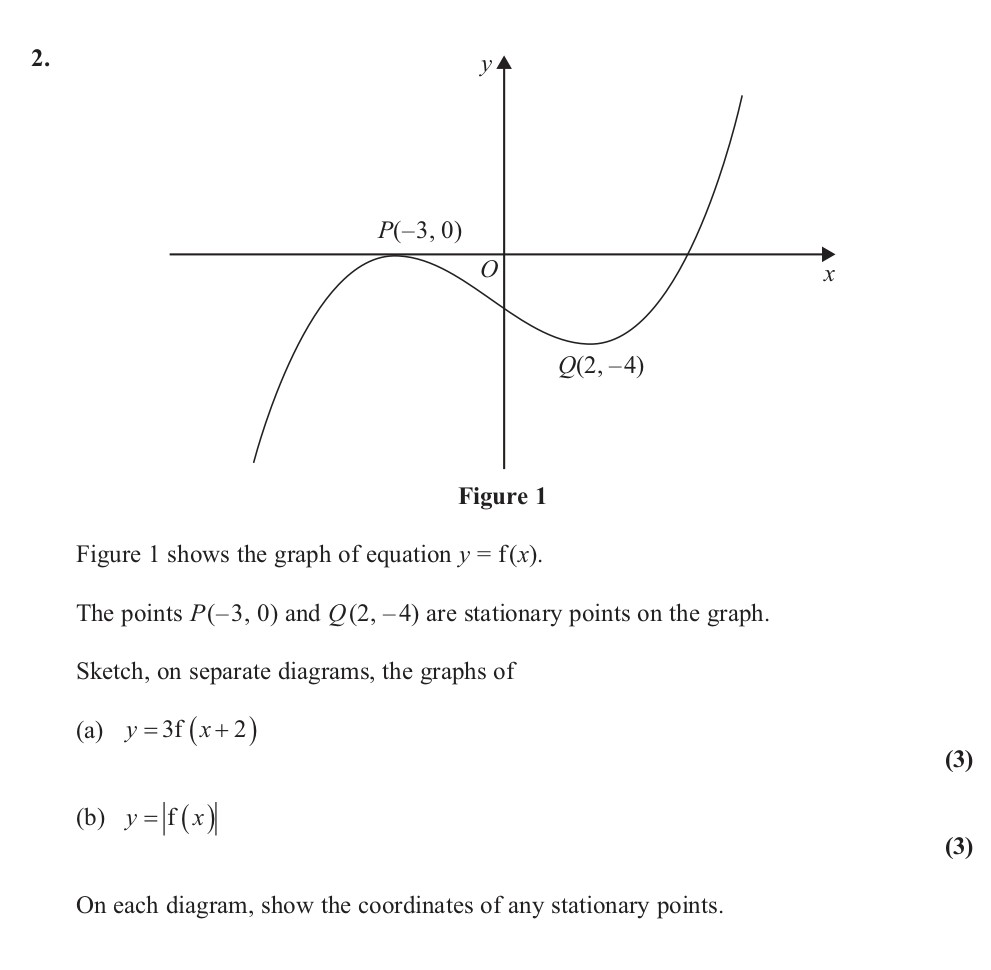
Figure 1 shows the graph of equation $y = f(x)$ - Edexcel - A-Level Maths Pure - Question 3 - 2012 - Paper 6
Question 3

Figure 1 shows the graph of equation $y = f(x)$. The points $P(-3, 0)$ and $Q(2, -4)$ are stationary points on the graph. Sketch, on separate diagrams, the graph... show full transcript
Worked Solution & Example Answer:Figure 1 shows the graph of equation $y = f(x)$ - Edexcel - A-Level Maths Pure - Question 3 - 2012 - Paper 6
Step 1
Sketch $y = 3f(x + 2)$
Answer
To sketch the graph of , follow these steps:
-
Understanding the Transformation: The expression indicates a horizontal shift of the graph of to the left by 2 units. The factor of 3 in front of indicates a vertical stretch by a factor of 3.
-
Identifying Stationary Points: The stationary points of the original function are located at and . After shifting left by 2 units:
- Point moves to .
- Point moves to .
-
Applying the Vertical Stretch: Applying a vertical stretch of 3 will modify the y-coordinates of the stationary points:
- New point for : .
- New point for : .
-
Drawing the Graph: Draw the transformed graph maintaining the shape of the original function while ensuring that the points and are plotted correctly. Ensure the right section of the graph retains its characteristics as the original curve.
Step 2
Sketch $y = |f(x)|$
Answer
To sketch the graph of , consider the following:
-
Understanding Absolute Values: The absolute value function, , transforms any negative y-values of to their positive counterparts, while keeping positive values unchanged.
-
Identifying and Transforming Points: For the original points:
- Stationary point remains unchanged since is already non-negative.
- The stationary point will change to because we take the absolute value of .
-
Plotting the Graph: The new graph will reflect any part of the original function that is below the x-axis across to above the x-axis. Draw the usual shape for the above points, noting that the portion of the graph between and will be reflected to .
-
Final Touches: Ensure that all curves and points are combined to reflect the effect of taking absolute values, clearly displaying the new coordinates of the stationary points at and .
