Photo AI
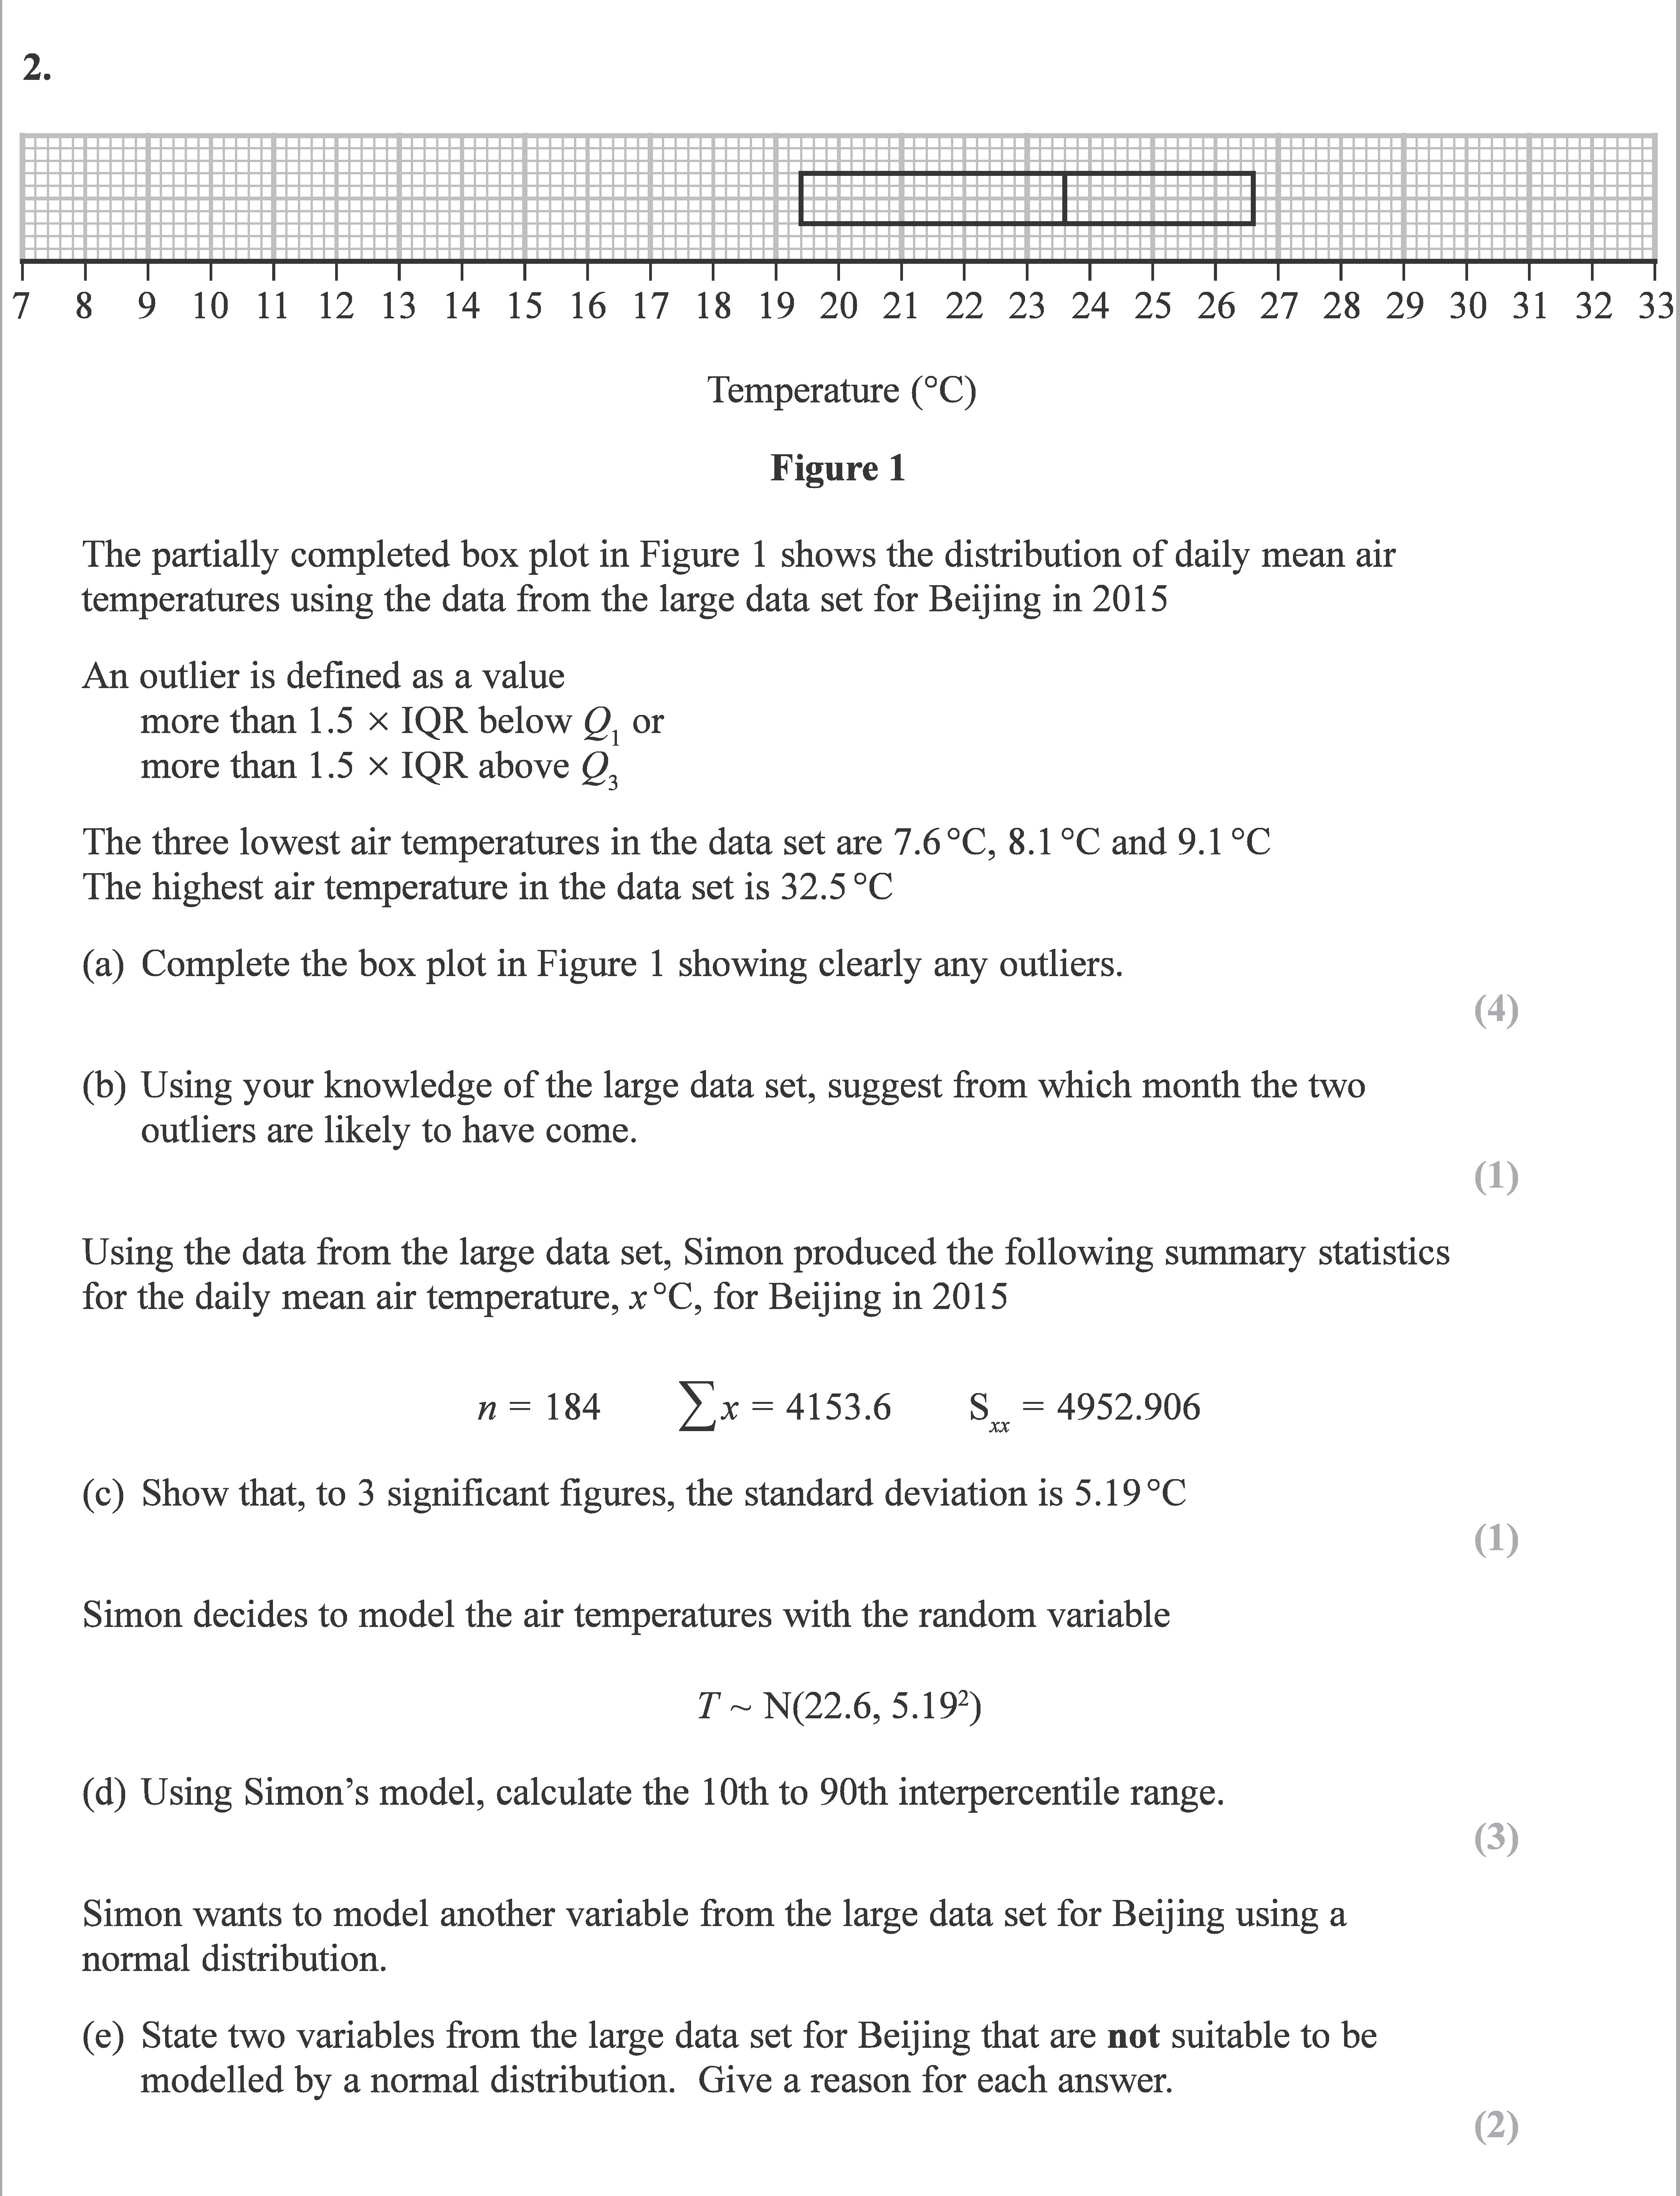
The partially completed box plot in Figure 1 shows the distribution of daily mean air temperatures using the data from the large data set for Beijing in 2015 - Edexcel - A-Level Maths Statistics - Question 2 - 2019 - Paper 1
Question 2

The partially completed box plot in Figure 1 shows the distribution of daily mean air temperatures using the data from the large data set for Beijing in 2015. An ou... show full transcript
Worked Solution & Example Answer:The partially completed box plot in Figure 1 shows the distribution of daily mean air temperatures using the data from the large data set for Beijing in 2015 - Edexcel - A-Level Maths Statistics - Question 2 - 2019 - Paper 1
Step 1
a) Complete the box plot in Figure 1 showing clearly any outliers.
Answer
To complete the box plot, we first calculate the interquartile range (IQR).
- First, determine Q1 and Q3 using the box plot.
-
The lower whisker (Q1) and upper whisker (Q3) already provided are 8.6°C and 26.6°C respectively.
-
Calculate the IQR:
-
- To find the outlier thresholds:
-
Lower threshold:
-
Upper threshold:
-
- Plot 7.6°C and 8.1°C as lower outliers and the highest temperature, 32.5°C, as an upper whisker, highlighting the outliers clearly in the box plot.
Step 2
b) Using your knowledge of the large data set, suggest from which month the two outliers are likely to have come.
Answer
Given the low values of 7.6°C and 8.1°C, these outlier temperatures are most likely associated with October, as it typically experiences the coldest temperatures among the months compared to those leading into winter.
Step 3
c) Show that, to 3 significant figures, the standard deviation is 5.19°C.
Answer
To calculate the standard deviation from the variance:
-
Start with the variance:
-
Find the standard deviation by taking the square root of the variance:
-
Calculating gives:
ightarrow 70.384 ext{ (rounded up to 3 significant figures: 5.19)} $$
Step 4
d) Using Simon's model, calculate the 10th to 90th interpercentile range.
Answer
Given the model for air temperatures is T ~ N(22, 5.19²):
-
Find the z-scores for the 10th and 90th percentiles:
- For the 10th percentile, z = -1.2816
- For the 90th percentile, z = 1.2816
-
Calculate the temperatures:
- For 10th percentile:
- For 90th percentile:
-
The interpercentile range is calculated as:
. Solving gives the required IPR.
Step 5
e) State two variables from the large data set for Beijing that are not suitable to be modeled by a normal distribution. Give a reason for each answer.
Answer
-
Rainfall:
- Rainfall data is often skewed and cannot take negative values, thus violating the normal distribution's assumptions.
-
Wind speed:
- Similar to rainfall, wind speed is not typically symmetrically distributed and is often limited to a certain range, making normal modeling inadequate.
