Photo AI
The table gives some information about the heights of 80 girls - Edexcel - GCSE Maths - Question 10 - 2018 - Paper 1
Question 10

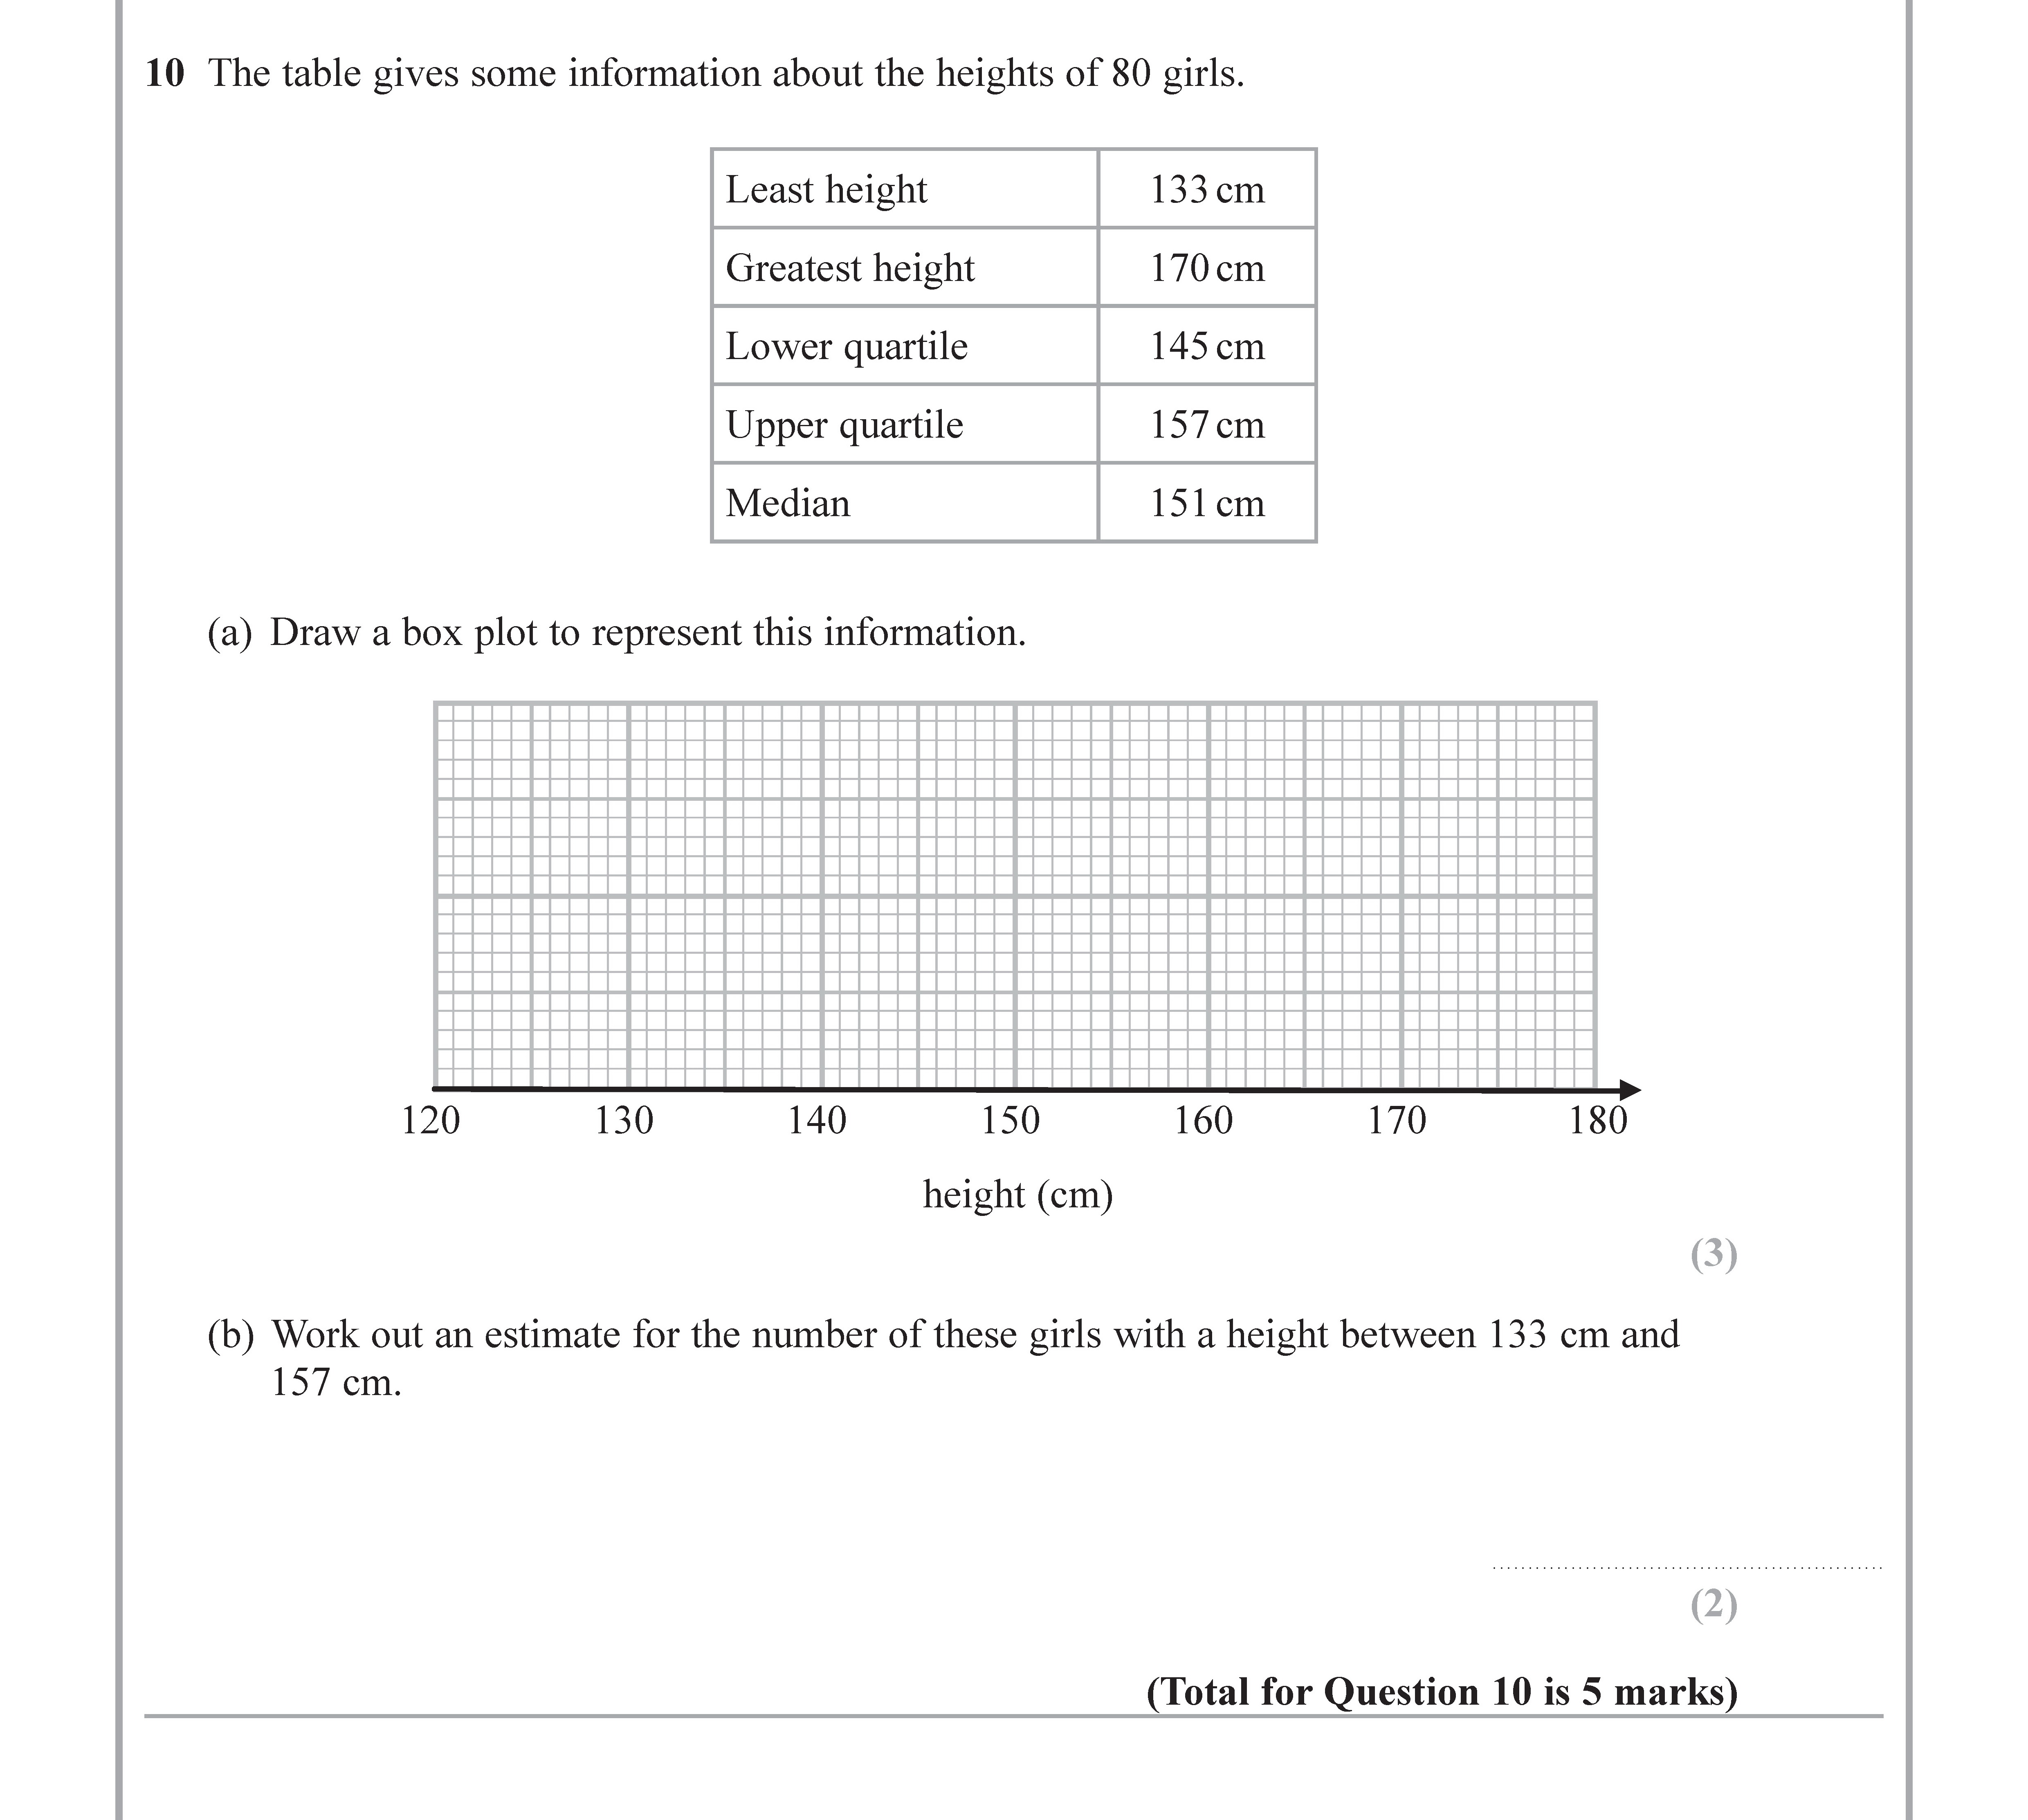
The table gives some information about the heights of 80 girls. Least height: 133 cm Greatest height: 170 cm Lower quartile: 145 cm Upper quartile: 157 cm Median: 1... show full transcript
Worked Solution & Example Answer:The table gives some information about the heights of 80 girls - Edexcel - GCSE Maths - Question 10 - 2018 - Paper 1
Step 1
Draw a box plot to represent this information
Answer
To draw a box plot, we need to identify the five key values: the least height, lower quartile, median, upper quartile, and greatest height.
-
Plot the Minimum Value (Least Height): Mark the lowest value at 133 cm on the horizontal axis.
-
Plot the Lower Quartile: Mark the lower quartile at 145 cm.
-
Plot the Median: Mark the median at 151 cm.
-
Plot the Upper Quartile: Mark the upper quartile at 157 cm.
-
Plot the Maximum Value (Greatest Height): Mark the highest value at 170 cm.
-
Draw the Box: Create a box from the lower quartile (145 cm) to the upper quartile (157 cm).
-
Draw the Whiskers: Extend lines (whiskers) from the ends of the box to the minimum height (133 cm) and maximum height (170 cm).
-
Label the Box Plot: Ensure to label the height (cm) on the x-axis and display the entire range clearly.
Step 2
Work out an estimate for the number of these girls with a height between 133 cm and 157 cm
Answer
To estimate the number of girls with a height between 133 cm and 157 cm:
-
Identify the Range: The heights in this range are from the least height (133 cm) to the upper quartile (157 cm).
-
Determine the Total Number of Girls: The total number of girls is 80.
-
Estimate the Proportion of Girls within the Range: The lower quartile (145 cm) divides the lower half of the data, while the upper quartile (157 cm) gives insight into the upper half.
-
Calculate: Estimating the distribution, a rough estimate would find that girls within 133 cm to 145 cm represent about 25% of the total, and those between 145 cm and 157 cm another 25%. Therefore:
Total girls between 133 cm and 157 cm: 80 x 0.5 = 40 girls.
-
Conclusion: Hence, around 40 girls are estimated to have heights in this range.
