Photo AI
In an experiment to verify Joule's law, a heating coil was placed in a fixed mass of water - Leaving Cert Physics - Question 4 - 2016
Question 4

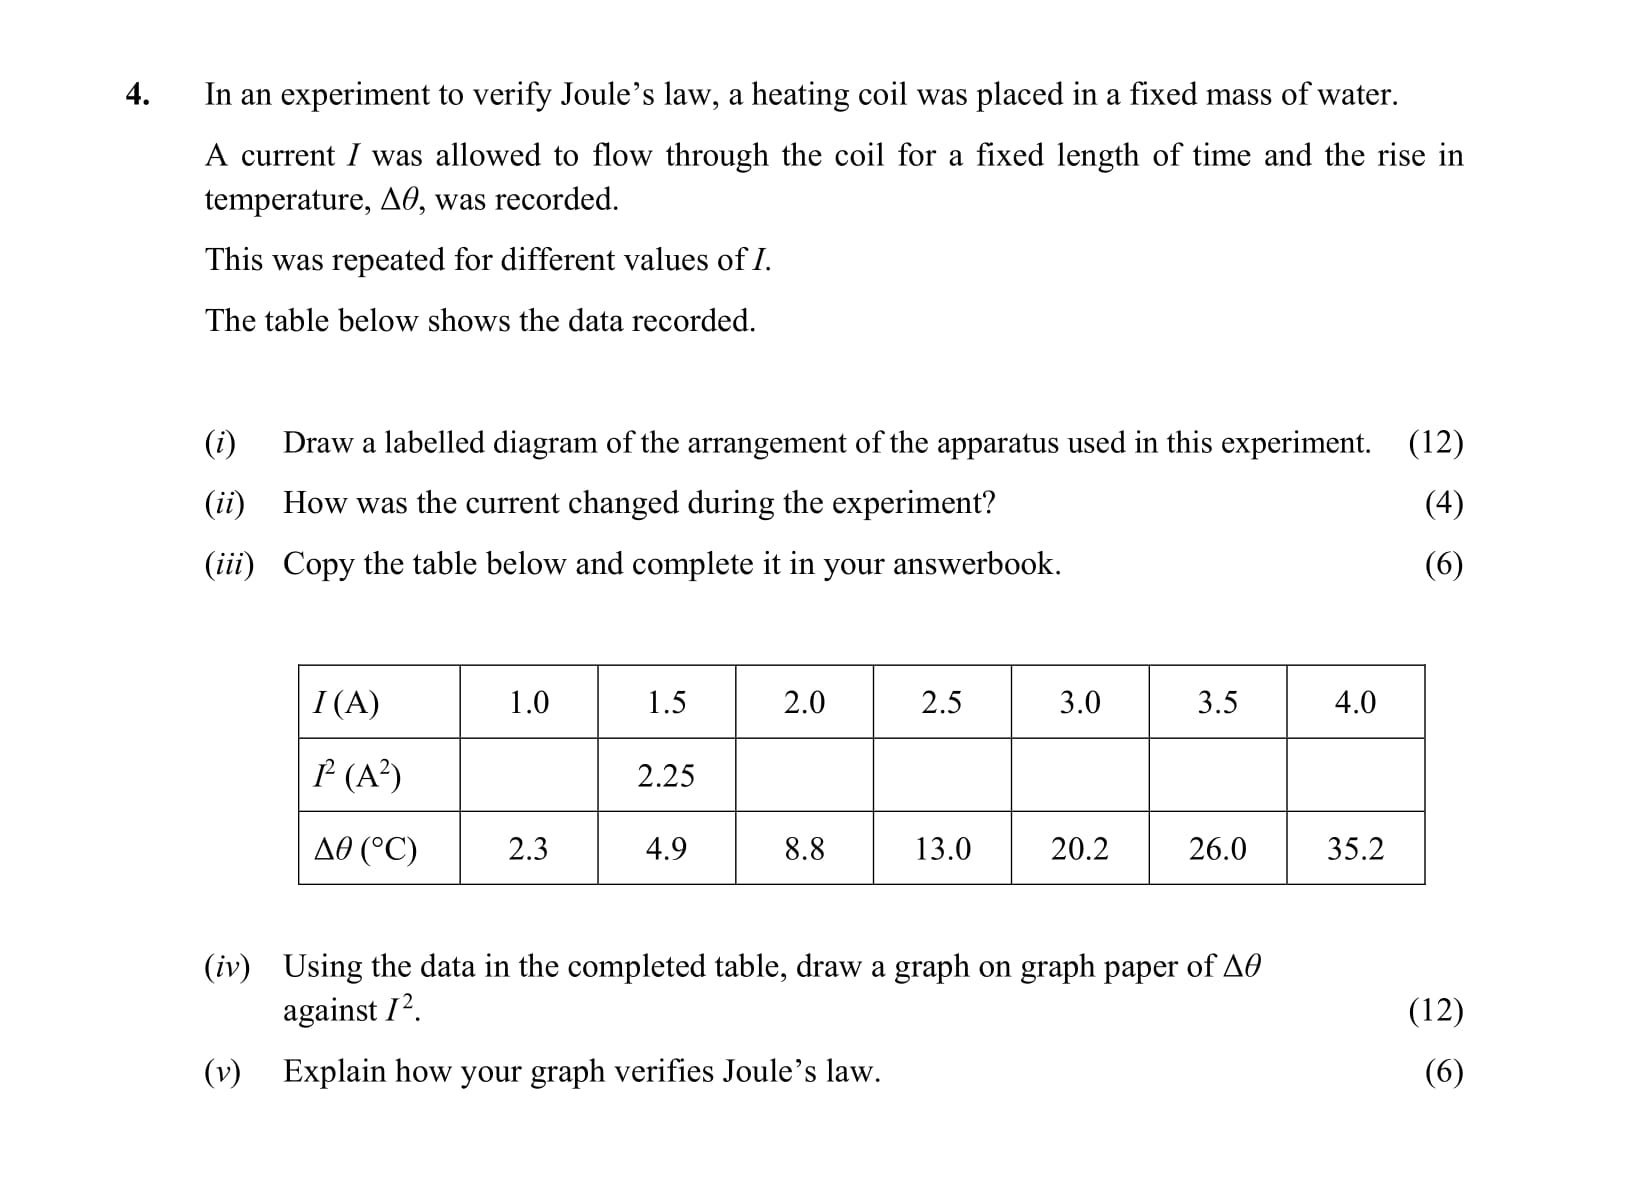
In an experiment to verify Joule's law, a heating coil was placed in a fixed mass of water. A current I was allowed to flow through the coil for a fixed length of t... show full transcript
Worked Solution & Example Answer:In an experiment to verify Joule's law, a heating coil was placed in a fixed mass of water - Leaving Cert Physics - Question 4 - 2016
Step 1
Draw a labelled diagram of the arrangement of the apparatus used in this experiment.
Answer
To draw a labelled diagram depicting the arrangement of the apparatus used in this experiment, include the following components:
- Heating Coil: Draw and label the heating coil where the current flows.
- Calorimeter: Indicate the container (calorimeter) that holds the fixed mass of water.
- Power Supply: Include the variable power supply that is adjusted.
- Thermometer: Label the thermometer used to measure the temperature of the water.
- Circuit Representation: Make sure to show connections representing a complete circuit.
Ensure each element is correctly labelled for clarity.
Step 2
How was the current changed during the experiment?
Answer
The current was changed during the experiment by adjusting the variable resistor (rheostat) or the power supply, which allows the experimenter to set different values of current I.
This adjustment enables the researcher to observe the corresponding change in temperature rise ∆θ in water.
Step 3
Step 4
Using the data in the completed table, draw a graph on graph paper of ∆θ against I².
Answer
To graph ∆θ against I²:
-
Calculate I²: Compute the square of each value of I:
- For I = 1.0 A, I² = 1.0
- For I = 1.5 A, I² = 2.25
- For I = 2.0 A, I² = 4.0
- For I = 2.5 A, I² = 6.25
- For I = 3.0 A, I² = 9.0
- For I = 3.5 A, I² = 12.25
-
Plot the Points: On graph paper, plot the values of I² on the x-axis and ∆θ on the y-axis.
-
Draw a Line: Connect the points with a straight line, showcasing the linear relationship.
Step 5
Explain how your graph verifies Joule's law.
Answer
The graph verifies Joule's law, which states that the heat produced by a conductor is proportional to the square of the current flowing through it.
-
Linear Relationship: The linearity of the graph indicates that as the current squared (I²) increases, the rise in temperature (∆θ) also increases proportionally.
-
Direct Proportionality: This supports the formula:
This correlation demonstrates the direct relationship as stated in Joule's law, validating the experimental findings.
